Who Am I?

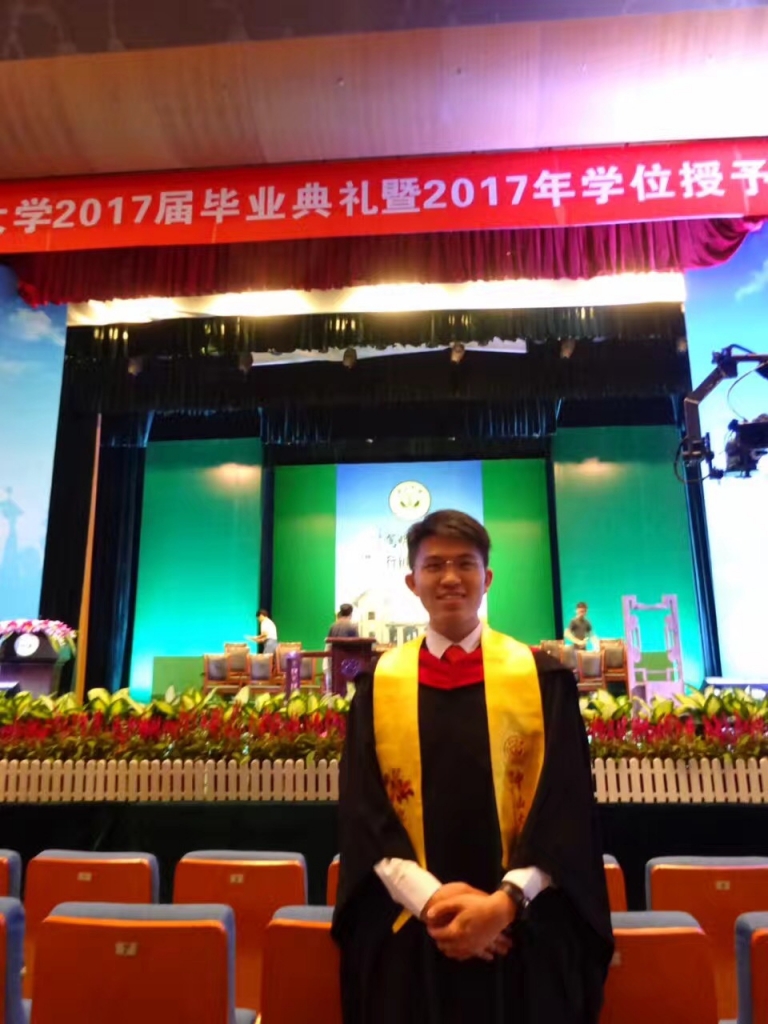
Majoring Computer Science (Machine Learning track) at Georgia Institute of Technology. Graduated from Johns Hopkins University with master degree on Applied Mathematics and Statistics. Programming experience in R, Python, Matlab, SQL and Linux shell. Knowledge in Statistical Models, Machine Learning and Big Data. Self-motivated and passionate about data analysis. Good communicative skills with team spirit.

  • Scholar Candidate of Data Incubator, 2018 Summer (2-3% Selection Rate)

  • Meritorious Winner of Interdisciplinary Contest in Modelling (ICM), 2016 (Top 10% Worldwide)

  • Winner of UCLA Cross-disciplinary Scholars in Science and Technology (CSST), 2016 (Top 100 International Undergrads)

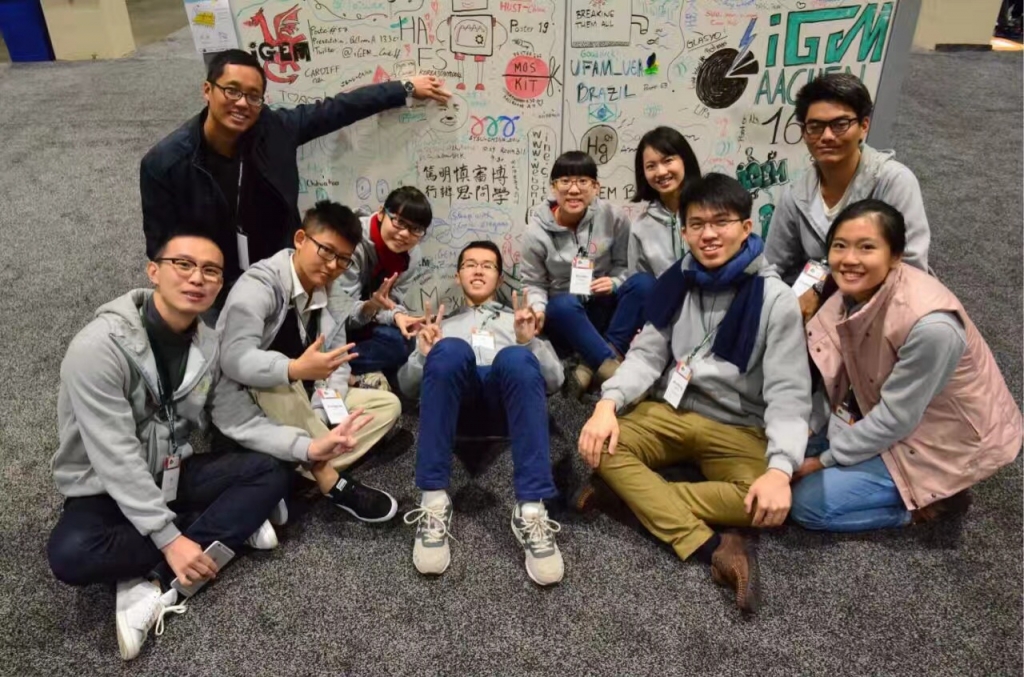
  • Gold Medal in International Genetically Engineered Machine (iGEM) held in Boston, 2016

Skills

Python
R
Tableau
SQL
Matlab

Profile Picture

Ancheng Deng
Ancheng DengAnalyst - Marketing Analytics
Github
I recently joined American Express as a Data Scientist working on digital credit product/journey analytics.

Work Experience

Atlanta, GA, Dec 2019 - Apr 2021

Phoenix, AZ, Feb 2019 - Nov 2019

  • Utilized Hadoop and Hive SQL to support deep dive in product analytics based on customer segments, referral domain and defined user behaviours
  • Conducted cross-validation on both front-end Javascript tags and back-end Hive tables to ensure data quality and integrity for Web analytics
  • Designed AB/Full Factorial test framework, worked with vendor on test deployment and made conclusion out of testing result
  • Created monthly performance reports on credit/charge card products using Tableau, Adobe Analytics and ClickTale
Allen, TX, Oct - Dec 2018

  • Utilized Machine Learning in H2O for set-top box failure prediction
  • Performed ETL in MongoDB with JSON Studio; Used Edge for visualization
  • Drafted training tutorial documents on H2O REST API workflow
Baltimore, Maryland, May - Dec 2018

  • Cleaned and audited medical dataset with > 30 indicators for over 70 hospitals in Qatar to ensure data and report quality, using Excel and Stata
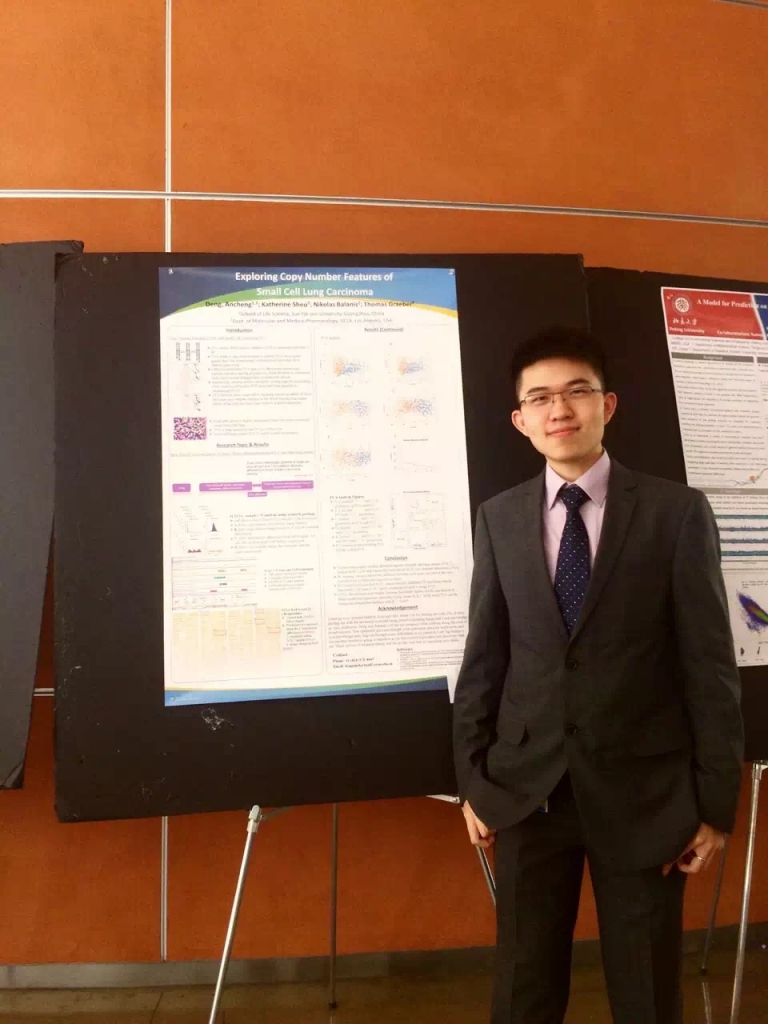
  • Built machine learning models in Python for lung cancer prediction with NLST dataset (over 53,000 cases)
  • Performed cross-validation hyper parameter tuning using XGBoost-GPU in Python

Guangzhou, China, May-Aug 2017

  • Built Python web crawler pipelines to monitor over 200+ live-broadcasting categories; Generated weekly report with crawler
    data and internal SQL database reflecting business trends; Conducted barrage analysis for public sentiment monitoring; Used
    Excel and R for data visualization
  • Increased efficiency by ~50% in implementation of web data monitoring with lower block rate; Supported senior leadership
    with data interpretation and decision making; Created new method of public sentiment monitoring through barrage analysis

Guangzhou, China, Mar-Aug 2016

  • Standardized data formats, unreadable symbols and imputed missing values for over >1 million data entries; Reverse
    generated TV program timetables (called RG-timetables); Classified TV programs into 15 categories for preference analysis;
    Conducted Association Rules analysis on 9 segmented time ranges; Analyzed audience flow and kept track of audience TV
    watching behavior within a day; All data analysis and visualization done in R programming
  • Restored ~90% of the missing values using KNN; Sampled RG-timetables are verified by official program tables; Discovered
    unexpected patterns that Cartoons are watched more often than News or Sports; Association Rules showed that people tend
    to watch TV in a consecutive time instead of multipeak; Audience flow analysis indicated that a large group of audience focus
    solely on programs between 17-21, corresponding to the ‘Prime Time’

Some of My Best Work Is Featured Below