Data Portfolio
Where you can find most of my projects associated with Data Analysis, Machine Learning and Data Visualization. Some of the projects are course related and some come out of my interest during spare time.
Code Portfolio
This section is where I store the code with explanation for projects in Data Portfolio.
Blog
Besides projects, I am also a fan of blog writing. I love to share daily ideas and experience with friends and family who would also like to know more aspects of me.
Gallery
As a Canon Beginner, I allow the gallery section to supervise me getting hands on the camera in my spare time instead of PUBG, which already took my huge amount of time. Feel free to comment on the photos and I'd love to know how you feel about them.
All these beautiful pictures are photoed by myself, come take a look!
Code Portfolio
This is where you can find the mechanism behind each project. Basically I use Python, R as well as Tableau for data preparation, model selection, evaluation and visualization. I will also provide my Github link to most of the codes so you may download the whole project code for reference at once.
Recent Post
Best/fastest way to migrate your entire conda env to larger storage (Linux/Ubuntu)
Background I've recently run into a storage panic when my DIY-built Machine Learning desktop is running out of storage in the system SSD drive (128 GB). After desperately searching online for various options, [...]
Although Python is not as fast as basic programming languages such as C++ and Java in terms of running time, it's a fluent language which can enable programmers to realize their ideas in a much shorter time -- really important when testing methods and models.
Data scientists use Python very often in order to quickly test various models and select the best one. You can find various Python packages I used in my project, including but not limiting to scikit-learn, pandas, numpy, and tensorflow.
R is one of the most used software by Statistician and Data Scientists not only because of its powerful statistical packages such as e1071, lme4, but also because of its powerful visualization tools ggplot2, ggmap and Rshiny. Recent news shows that R & Python might collaborate with each other and bring each more powerful software to the world. Let's wait and see.
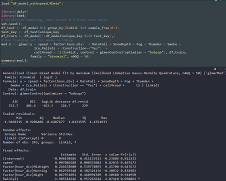
R is the language that I use for a long time and it's really proven itself to be a reliable statistical tools and compatible with various data formats. During my projects I used R packages such as dplyr, reshape2, lme4, ggplot2 and ggmap to do most of the data cleaning and model building jobs.
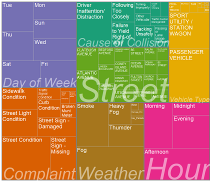
Tableau is the most intellectual data visualization tools I've ever used - easy to learn and the results are beautiful. One geographical heatmap in R requires tens of parameters, while with Tableau you just need to drag the data into the map icon and the software automatically searches for information it needs and renders the plot.
One of the most competitive feature in Tableau is its dynamic dashboard. You can deploy it on you website and see real-time response when doing filtering and selecting online. I utilized Tableau in one of my projects where I was trying to visualize the whereabouts of my undergraduate classmates, which has received a huge response in my graduation day.


