Here is an interesting package called 'profvis' that I recently get to know about. It is quite useful when you are trying to locate the place where takes the longest time when running the code. Below is an official example.
#R system monitoring
install.packages('profvis')
library(profvis)
# To run code with profiling, wrap the expression in profvis(). By default, this will result in the interactive
# profile visualizer opening in a web browser. You can see a live demo here.
profvis({
library(ggplot2)
g <- ggplot(diamonds, aes(carat, price)) + geom_point(size = 1, alpha = 0.2)
print(g)
})
# The profvis() call returns an htmlwidget, which by default when printed opens a
# web browser. If you wish to save the object,
# it won't open the browser at first, but you can
# view it later by typing the variable name at the console, or calling print() on it.
p <- profvis({
g <- ggplot(diamonds, aes(carat, price)) + geom_point(size = 1, alpha = 0.2)
print(g)
})
# View it with:
p
# or print(p)
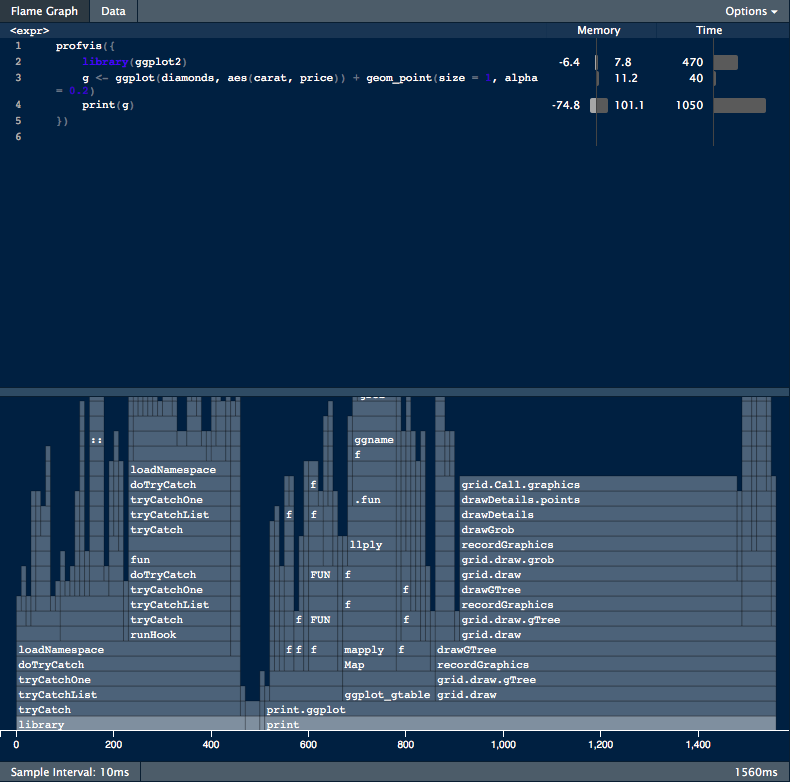
# On top is the code, and on the bottom is a flame graph.
# In the flame graph, the horizontal direction represents time in
# milliseconds, and the vertical direction represents the call stack.
# Looking at the bottom-most items on the stack, most of the time,
# about 2 seconds, is spent in plot, and then a much smaller amount
# of time is spent in lm, and almost no time at all is spent in abline –
# it doesn’t even show up on the flame graph.
Leave A Comment