XGBOOST
Data Preparation
Data Preparation for Gradient Boosting with XGBoost in Python
xgboost使用经验总结
▲多类别分类时,类别需要从0开始编码
▲Watchlist不会影响模型训练。
▲类别特征必须编码,因为xgboost把特征默认都当成数值型的
▲调参:Notes on Parameter Tuning以及 Complete Guide to Parameter Tuning in XGBoost (with codes in Python)
https://github.com/dmlc/xgboost/blob/master/doc/param_tuning.md
▲训练的时候,为了结果可复现,记得设置随机数种子。
▲XGBoost的特征重要性是如何得到的?某个特征的重要性(feature score),等于它被选中为树节点分裂特征的次数的和,比如特征A在第一次迭代中(即第一棵树)被选中了1次去分裂树节点,在第二次迭代被选中2次…..那么最终特征A的feature score就是 1+2+….
Possible Bugs
warm_start is being used properly. There's actually a bug that's preventing this from working.
The workaround in the meantime is to copy the array to a C-contiguous array:
X_train = np.copy(X_train, order='C')
X_test = np.copy(X_test, order='C')
xgboost优势
▲传统GBDT以CART作为基分类器,xgboost还支持线性分类器,这个时候xgboost相当于带L1和L2正则化项的逻辑斯蒂回归(分类问题)或者线性回归(回归问题)。
▲传统GBDT在优化时只用到一阶导数信息,xgboost则对代价函数进行了二阶泰勒展开,同时用到了一阶和二阶导数。顺便提一下,xgboost工具支持自定义代价函数,只要函数可一阶和二阶求导。
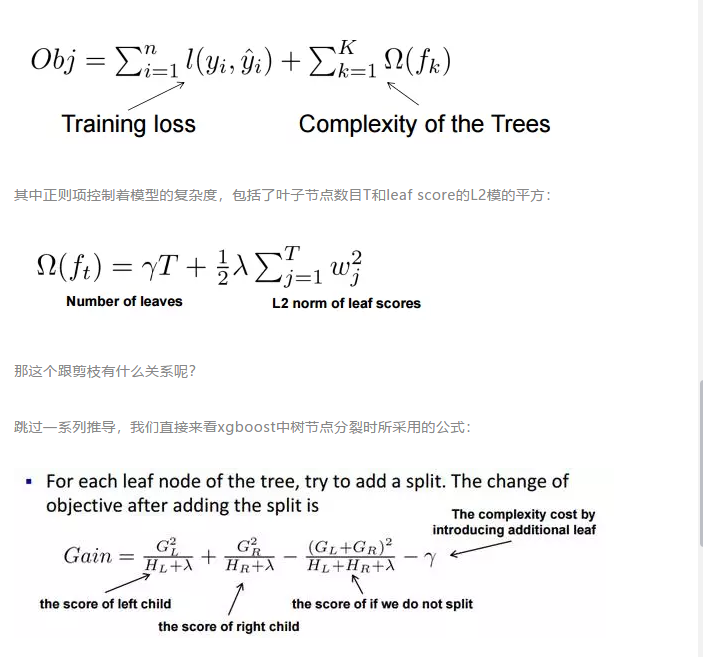
▲xgboost在代价函数里加入了正则项,用于控制模型的复杂度。正则项里包含了树的叶子节点个数、每个叶子节点上输出的score的L2模的平方和。从Bias-variance tradeoff角度来讲,正则项降低了模型的variance,使学习出来的模型更加简单,防止过拟合,这也是xgboost优于传统GBDT的一个特性。
▲Shrinkage(缩减),相当于学习速率(xgboost中的eta)。xgboost在进行完一次迭代后,会将叶子节点的权重乘上该系数,主要是为了削弱每棵树的影响,让后面有更大的学习空间。实际应用中,一般把eta设置得小一点,然后迭代次数设置得大一点。(补充:传统GBDT的实现也有学习速率)
▲列抽样(column subsampling):xgboost借鉴了随机森林的做法,支持列抽样,不仅能降低过拟合,还能减少计算,这也是xgboost异于传统gbdt的一个特性。
▲对缺失值的处理:对于特征的值有缺失的样本,xgboost可以自动学习出它的分裂方向。
▲xgboost工具支持并行:boosting不是一种串行的结构吗?怎么并行的?注意xgboost的并行不是tree粒度的并行,xgboost也是一次迭代完才能进行下一次迭代的(第t次迭代的代价函数里包含了前面t-1次迭代的预测值)。xgboost的并行是在特征粒度上的。我们知道,决策树的学习最耗时的一个步骤就是对特征的值进行排序(因为要确定最佳分割点),xgboost在训练之前,预先对数据进行了排序,然后保存为block结构,后面的迭代中重复地使用这个结构,大大减小计算量。这个block结构也使得并行成为了可能,在进行节点的分裂时,需要计算每个特征的增益,最终选增益最大的那个特征去做分裂,那么各个特征的增益计算就可以开多线程进行。
▲可并行的近似直方图算法:树节点在进行分裂时,我们需要计算每个特征的每个分割点对应的增益,即用贪心法枚举所有可能的分割点。当数据无法一次载入内存或者在分布式情况下,贪心算法效率就会变得很低,所以xgboost还提出了一种可并行的近似直方图算法,用于高效地生成候选的分割点。

这个公式形式上跟ID3算法(采用entropy计算增益) 、CART算法(采用gini指数计算增益) 是一致的,都是用分裂后的某种值 减去 分裂前的某种值,从而得到增益。为了限制树的生长,我们可以加入阈值,当增益大于阈值时才让节点分裂,上式中的gamma即阈值,它是正则项里叶子节点数T的系数,所以xgboost在优化目标函数的同时相当于做了预剪枝。另外,上式中还有一个系数lambda,是正则项里leaf score的L2模平方的系数,对leaf score做了平滑,也起到了防止过拟合的作用,这个是传统GBDT里不具备的特性。
[预剪枝和后剪枝]
预剪枝就是在树的构建过程(只用到训练集),设置一个阈值(样本个数小于预定阈值或GINI指数小于预定阈值),使得当在当前分裂节点中分裂前和分裂后的误差超过这个阈值则分列,否则不进行分裂操作
后剪枝是在用训练集构建好一颗决策树后,利用测试集进行的操作。
Course: Boosting - wisdom of the crowd | Parrot Prediction's School

Plotting
You can use plotting module to plot importance and output tree.
To plot importance, use :py:meth:xgboost.plot_importance. This function requires matplotlib to be installed.
xgb.plot_importance(bst)
To plot the output tree via matplotlib, use :py:meth:xgboost.plot_tree, specifying the ordinal number of the target tree. This function requires graphviz and matplotlib.
xgb.plot_tree(bst, num_trees=2)
When you use IPython, you can use the :py:meth:xgboost.to_graphviz function, which converts the target tree to a graphviz instance. The graphviz instance is automatically rendered in IPython.
xgb.to_graphviz(bst, num_trees=2)
Difference between lower level xgb.train and xgboost.XGBClassifier
- xgboost.train allows to set the callbacks applied at end of each iteration.
- xgboost.train allows training continuation via xgb_model parameter.
- xgboost.train allows not only minization of the eval function, but maximization as well.
Possible hyperparameters to tune:
- eta (default=0.3) [Learning Rate]
- min_child_weight (default=1) [minimum sum of weights of all observations required in a child] Used to control over-fitting. Higher values prevent a model from learning relations which might be highly specific to the particular sample selected for a tree; Too high values can lead to under-fitting hence, it should be tuned using CV.
- max_depth (default=6) [maximum depth of a tree] Used to control over-fitting as higher depth will allow model to learn relations very specific to a particular sample. Should be tuned using CV.
- gamma (default=0) [Gamma specifies the minimum loss reduction required to make a split.] Makes the algorithm conservative. The values can vary depending on the loss function and should be tuned.
- subsample (default=1) [Denotes the fraction of observations to be randomly samples for each tree.]
- colsample_bytree (default=1) [Denotes the fraction of columns to be randomly samples for each tree.]
objective (default=reg:linear) This defines the loss function to be minimized.
Mostly used values are:
binary:logistic –logistic regression for binary classification, returns predicted probability (not class)
multi:softmax –multiclass classification using the softmax objective, returns predicted class (not probabilities)
you also need to set an additional num_class (number of classes) parameter defining the number of unique classes
multi:softprob –same as softmax, but returns predicted probability of each data point belonging to each class.
- eval_metric (default rmse for regression and error for classification
Typical values are:
rmse – root mean square error
mae – mean absolute error
logloss – negative log-likelihood
error – Binary classification error rate (0.5 threshold)
merror – Multiclass classification error rate
mlogloss – Multiclass logloss
auc: Area under the curve
Some of the best XGBoost self-learning website (teach you how to do hyperparameter tuning in XGBoost): https://cambridgespark.com/content/tutorials/hyperparameter-tuning-in-xgboost/index.html
And here is code I borrowed from https://www.kaggle.com/jeremy123w/xgboost-with-roc-curve/code to show XGBoost ROC curve: (you can download the example dataset here)
import numpy as np # linear algebra
import pandas as pd # data processing, CSV file I/O (e.g. pd.read_csv)
from sklearn.cross_validation import train_test_split
from sklearn.metrics import mean_squared_error
from operator import itemgetter
import xgboost as xgb
import random
import time
from sklearn.grid_search import GridSearchCV
from sklearn.metrics import average_precision_score
import matplotlib.pyplot as plt
from numpy import genfromtxt
import seaborn as sns
from sklearn import preprocessing
from sklearn.metrics import roc_curve, auc,recall_score,precision_score
import datetime as dt
# Input data files are available in the "../input/" directory.
# For example, running this (by clicking run or pressing Shift+Enter) will list the files in the input directory

from subprocess import check_output
print(check_output(["ls", "../input"]).decode("utf8"))


def create_feature_map(features):
    outfile = open('xgb.fmap', 'w')
    for i, feat in enumerate(features):
        outfile.write('{0}\t{1}\tq\n'.format(i, feat))
    outfile.close()


def get_importance(gbm, features):
    create_feature_map(features)
    importance = gbm.get_fscore(fmap='xgb.fmap')
    importance = sorted(importance.items(), key=itemgetter(1), reverse=True)
    return importance

def get_features(train, test):
    trainval = list(train.columns.values)
    output = trainval
    return sorted(output)


def run_single(train, test, features, target, random_state=0):
    eta = 0.1
    max_depth= 6
    subsample = 1
    colsample_bytree = 1
    min_chil_weight=1
    start_time = time.time()

    print('XGBoost params. ETA: {}, MAX_DEPTH: {}, SUBSAMPLE: {}, COLSAMPLE_BY_TREE: {}'.format(eta, max_depth, subsample, colsample_bytree))
    params = {
        "objective": "binary:logistic",
        "booster" : "gbtree",
        "eval_metric": "auc",
        "eta": eta,
        "tree_method": 'exact',
        "max_depth": max_depth,
        "subsample": subsample,
        "colsample_bytree": colsample_bytree,
        "silent": 1,
        "min_chil_weight":min_chil_weight,
        "seed": random_state,
        #"num_class" : 22,
    }
    num_boost_round = 500
    early_stopping_rounds = 20
    test_size = 0.1


    X_train, X_valid = train_test_split(train, test_size=test_size, random_state=random_state)
    print('Length train:', len(X_train.index))
    print('Length valid:', len(X_valid.index))
    y_train = X_train[target]
    y_valid = X_valid[target]
    dtrain = xgb.DMatrix(X_train[features], y_train, missing=-99)
    dvalid = xgb.DMatrix(X_valid[features], y_valid, missing =-99)

    watchlist = [(dtrain, 'train'), (dvalid, 'eval')]
    gbm = xgb.train(params, dtrain, num_boost_round, evals=watchlist, early_stopping_rounds=early_stopping_rounds, verbose_eval=True)

    print("Validating...")
    check = gbm.predict(xgb.DMatrix(X_valid[features]), ntree_limit=gbm.best_iteration+1)

    #area under the precision-recall curve
    score = average_precision_score(X_valid[target].values, check)
    print('area under the precision-recall curve: {:.6f}'.format(score))


    check2=check.round()
    score = precision_score(X_valid[target].values, check2)
    print('precision score: {:.6f}'.format(score))

    score = recall_score(X_valid[target].values, check2)
    print('recall score: {:.6f}'.format(score))

    imp = get_importance(gbm, features)
    print('Importance array: ', imp)

    print("Predict test set... ")
    test_prediction = gbm.predict(xgb.DMatrix(test[features],missing = -99), ntree_limit=gbm.best_iteration+1)
    score = average_precision_score(test[target].values, test_prediction)

    print('area under the precision-recall curve test set: {:.6f}'.format(score))

    ############################################ ROC Curve


    # Compute micro-average ROC curve and ROC area
    fpr, tpr, _ = roc_curve(X_valid[target].values, check)
    roc_auc = auc(fpr, tpr)
    #xgb.plot_importance(gbm)
    #plt.show()
    plt.figure()
    lw = 2
    plt.plot(fpr, tpr, color='darkorange',
             lw=lw, label='ROC curve (area = %0.2f)' % roc_auc)
    plt.plot([0, 1], [0, 1], color='navy', lw=lw, linestyle='--')
    plt.xlim([-0.02, 1.0])
    plt.ylim([0.0, 1.05])
    plt.xlabel('False Positive Rate')
    plt.ylabel('True Positive Rate')
    plt.title('ROC curve')
    plt.legend(loc="lower right")
    plt.show()
    ##################################################


    print('Training time: {} minutes'.format(round((time.time() - start_time)/60, 2)))
    return test_prediction, imp, gbm.best_iteration+1


# Any results you write to the current directory are saved as output.
start_time = dt.datetime.now()
print("Start time: ",start_time)

data=pd.read_csv('../input/creditcard.csv')

train, test = train_test_split(data, test_size=.1, random_state=random.seed(2016))


features = list(train.columns.values)
features.remove('Class')
print(features)


print("Building model.. ",dt.datetime.now()-start_time)
preds, imp, num_boost_rounds = run_single(train, test, features, 'Class',42)

print(dt.datetime.now()-start_time)
Leave A Comment