
前言
临近毕业,同学们最关心的事情,除了毕业照如何把自己拍的美美哒,就是自己的小伙伴们都去哪儿了。那么我们生科院2017届225名小伙伴们,你们都去哪儿了呢?
本人最近接触到Tableau,惊于其十分完美的地理绘图功能,希望能够借此学习的机会,也为小伙伴们提供一个生科院去向的全球化视野,当然也可以为学弟学妹们提供一定的指导和借鉴啦。
2017 Graduates Whereabouts

使用方法
放大/缩小:鼠标滚轮
移动地图:shift+鼠标拖动
筛选:在地图上进行多边形选择;或者在右上角选择框内进行类别筛选(专业名称或性别)
该数据的交互式可视化在于可以在地图上进行多边形筛选,并且随筛选项目,专业占比,性别占比和详细去向数据表都会随之更新,非常适合进行由整体到详细的数据查看。
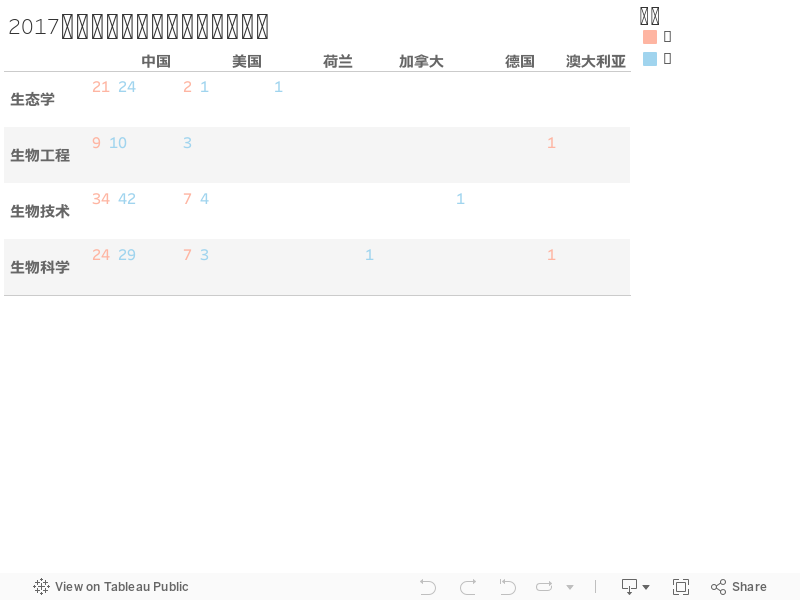
那么,如果大家对于仪表板(dashboard)当中的百分比不是很感冒,我另外提供了一份详细的原始数据表格。其也是一种动态交互式表格,默认为国家尺度;点击表格左上角的一个“+”号,可以将表格放大为城市尺度,各取所需啦~
制作流程
数据清洗与地址填充
拿到excel数据之后,首先要进行数据的审核,发现当中仅仅有去向单位的全称,并没有国家、城市和省份的匹配信息。因此想到使用R进行数据清洗和地址的填充。
数据清洗用于去除敏感信息;地址填充的话我考虑到方便快捷性,决定摒弃人肉填充的方法,使用高德地图和国外个人开发的逆地理编码API分别对国内地址和国外地址进行提取。逆地理编码是指通过api接口输入目的地全程,返回目的地的所有层级信息和GPS地址。之后通过正则匹配提取出结构化的信息。另外,对于国外大学的英文名称,原始数据中是没有空格的,因此我还使用了R当中的jiebaR分词构建用户词典,将学校名称分开之后再使用API。
R语言可以实现上述所有功能,加载的包为RCurl,stringr,和xlsx。分别用于api访问,字段处理和读取写入excel。下面直接贴上代码供参考,因原始数据不方便提供因此读者可能无法复现。
# BaiduAPI Geolocation Reverse Coding
# Ancheng Deng
# 2017/07/26

library(RCurl)
library(stringr)
URL = getURL("http://api.map.baidu.com/cloudgc/v1?ak=7sUyrOIrOq6V8bkyMcr3ukixyFL1n0Gi&address=%E4%B8%AD%E5%B1%B1%E5%A4%A7%E5%AD%A6&output=json")
province = str_extract(URL, "\".{0,3}省")
city = str_extract(URL, "\".{0,3}市")
district = str_extract(URL, "\".{0,3}区")


# ---- create function
gettingGeoLocation <- function(address, ak = "7sUyrOIrOq6V8bkyMcr3ukixyFL1n0Gi"){
  URL = getURL(paste0("http://api.map.baidu.com/cloudgc/v1?ak=", ak, "&address=", address))
  province = str_sub(str_extract(URL, "\".{0,3}省"), start = 2, end = -1)
  city = str_sub(str_extract(URL, "\".{0,3}市"), start = 2, end = -1)
  district = str_sub(str_extract(URL, "\".{0,3}区"), start = 2, end = -1)
  return(list(province, city, district))
}

a <- gettingGeoLocation("暨南大学")

# ----

# read in
library(xlsx)
student_info <- read.xlsx("C:/Users/Administrator/Desktop/2017届学生就业单位.xls", sheetIndex = 1, header = TRUE, encoding = "UTF-8")
str(student_info)
student_info$就业率统计具体单位 <- as.character(student_info$就业率统计具体单位)

########
loc_list = c()
for (i in student_info$就业率统计具体单位){
  loc_list = c(loc_list, list(gettingGeoLocation(i)))
}
#######

# --- function to complete the dataframe
autofillingLoc <- function(student_info){
  student_info <- transform(student_info, province = NA, city = NA, district = NA)
  for (i in 1:nrow(student_info)){
    loc_list = gettingGeoLocation(student_info$就业率统计具体单位[i])
    student_info$province[i] = loc_list[[1]]
    student_info$city[i] = loc_list[[2]]
    student_info$district[i] = loc_list[[3]]
  }
  return(student_info)
}

student_info_fill <- autofillingLoc(student_info) # all Foreign Location --> delete
student_info_fill[grepl("美国|德国|加拿大|澳大利亚|荷兰", student_info_fill$就业率统计具体单位),
                  c("province", "city", "district")] <- NA
# add column as Country
student_info_fill[, "country"] <- "中国"
student_info_fill[grepl("美国", student_info_fill$就业率统计具体单位),
                  c("country")] <- "美国"
student_info_fill[grepl("德国", student_info_fill$就业率统计具体单位),
                  c("country")] <- "德国"
student_info_fill[grepl("加拿大", student_info_fill$就业率统计具体单位),
                  c("country")] <- "加拿大"
student_info_fill[grepl("澳大利亚", student_info_fill$就业率统计具体单位),
                  c("country")] <- "澳大利亚"
student_info_fill[grepl("荷兰", student_info_fill$就业率统计具体单位),
                  c("country")] <- "荷兰"
# 对于国外地址使用英文进行搜索
# https://nominatim.openstreetmap.org/search/University%20of%20columbia%20?format=json&addressdetails=1&limit=1&polygon_svg=1
# https://nominatim.openstreetmap.org/search/UniversityofToronto?format=json&addressdetails=1&limit=1&polygon_svg=1
# first extract the context from the parentheses, then seperate them with space
loc_eng <- str_extract(student_info_fill$就业率统计具体单位, "\\(.{3,}\\)")
log_eng <- str_sub(loc_eng, 2, -2)
library(jiebaR)
wk = worker()

log_eng_sep = c()
for (i in 1:length(log_eng)){
  if(!is.na(log_eng[i])) log_eng_sep = c(log_eng_sep, paste(wk[log_eng[i]], collapse = " "))
  else log_eng_sep = c(log_eng_sep, NA)
}
log_eng_sep

for (i in 1:length(log_eng_sep)){
  if(!is.na(log_eng[i])) )
}

gettingForeignLocation <- function(address){
  URL = getURL(paste0("https://nominatim.openstreetmap.org/search/", str_replace_all(address, "\\s", "%20"),"?format=json&addressdetails=1&limit=1&polygon_svg=1"))
  province = str_sub(str_extract(URL, "state\":\".+postcode"), start = 9, end = -12)
  city = str_sub(str_extract(URL, "city\":\".+\",\"county"), start = 8, end = -10) #
  district = str_sub(str_extract(URL, "road\":\".+city"), start = 8, end = -8)
  return(list(province, city, district))
}


autofillingForeignLoc <- function(student_info){
  for (i in 1:nrow(student_info)){
    if(student_info_fill$country[i]!="中国"){
    loc_list = gettingForeignLocation(log_eng_sep[i])
    student_info$province[i] = loc_list[[1]]
    student_info$city[i] = loc_list[[2]]
    student_info$district[i] = loc_list[[3]]
    }
  }
  return(student_info)
}

#

student_info_fill <- autofillingForeignLoc(student_info_fill)

# output to excel
write.xlsx(student_info_fill, file = "student_info_fill.xlsx", sheetName = "毕业去向",showNA = FALSE)
做完这步之后当然还需要肉眼进行差错,确保地理数据都是合理正确的——当然check需要的时间是远少于人肉填充的。
Tableau使用
Tableau公司是目前数据可视化这个数据分析末端领域的龙头企业,业务遍布许多世界五百强公司,三位创始人分别是杰出的计算机科学家、曾获奥斯卡金像奖的教授和对数据充满热情的睿智商业领袖(https://www.tableau.com/zh-cn/about/mission)。那么个人用户可以免费使用public版本并且将自己的成果发布到自己的网站和Tableau社区当中。
我就随便倒腾了一下,连说明都不用看,真的超级容易上手——但是如果你要使用高级功能(比如汇总数据进行summary)的话,建议还是去看看官方的讲解视频或者网站资料,都有很详细的解决方案。
结语
数据可视化是一门科学也是一门艺术,科学在于找到什么方法去实现一张图中尽可能全面和有重点地展示信息;艺术在于细节,配色,结构等等——数据来自于生活的各个方面,希望未来大家都是自己生活中的数据分析可视化实践者。
Leave A Comment